在python开发过程中,针对性能较差的代码通常需要分析调整,以改善运行的效率。本文将简单介绍python常用的性能分析调整工具,更深入的使用可结合官方文档和实际项目进行实践。
timeit
如果项目中只需要简单统计运行时间的情况,timeit简单易用,可以配置任务次数测试运行性能情况。
12345678
import timeitdef test(): for i in xrange(100000): a = i * itimeit.timeit('test()', 'from __main__ import test', number=1)timeit.timeit('test()', 'from __main__ import test', number=10)
profile/cprofile
profile是使用语言都会提供的性能分析工具,cprofile是使用c语言实现的性能测试模块,提供的API和profile一样
运行结果的关键变量:
| 变量 | 含义 |
|---|---|
| ncall | 函数运行次数 |
| tottime | 函数的总的运行时间,减去函数中调用子函数的运行时间 |
| percall | 第一个 percall = tottime / nclall |
| cumtime | 函数及其所有子函数调整的运行时间,也就是函数开始调用到结束的时间。 |
| percall | 第二个 percall = cumtime / nclall |
123456789101112131415
import profileprofile.run('test()')-- here comes the result5 function calls in 0.002 secondsOrdered by: standard namencalls tottime percall cumtime percall filename:lineno(function) 1 0.000 0.000 0.000 0.000 :0(range) 1 0.001 0.001 0.001 0.001 :0(setprofile) 1 0.000 0.000 0.001 0.001 <string>:1(<module>) 0 0.000 0.000 profile:0(profiler) 1 0.000 0.000 0.002 0.002 profile:0(test()) 1 0.001 0.001 0.001 0.001 test.py:3(test)
line_profiler
首先需要安装line_profiler工具库,python2.7的安装可以pip install line_profiler。安装之后kernprof.py会加到环境变量中。line_profiler可以统计每行代码的执行次数和执行时间等,时间单位为微妙。
| 变量 | 含义 |
|---|---|
| Total Time | 测试代码的总运行时间 |
| Hits | 表示每行代码运行的次数 |
| Time | 每行代码运行的总时间 |
| Per Hits | 每行代码运行一次的时间 |
| % Time | 每行代码运行时间的百分比 |
1234567891011121314151617
import time@profiledef fun(): a = 0 b = 0 for i in range(100000): a = a + i * i for i in range(3): b += 1 time.sleep(0.1) return a + b# run testfun()
执行kernprof -l -v test_line_profiler.py
123456789101112131415161718192021
Wrote profile results to line_profile_test.py.lprofTimer unit: 1e-06 sTotal time: 0.411613 sFile: line_profile_test.pyFunction: fun at line 5Line # Hits Time Per Hit % Time Line Contents============================================================== 5 @profile 6 def fun(): 7 1 8.0 8.0 0.0 a = 0 8 1 1.0 1.0 0.0 b = 0 9 100001 46409.0 0.5 11.3 for i in range(100000): 10 100000 49603.0 0.5 12.1 a = a + i * i 11 12 4 27.0 6.8 0.0 for i in range(3): 13 3 5.0 1.7 0.0 b += 1 14 3 315558.0 105186.0 76.7 time.sleep(0.1) 15 16 1 2.0 2.0 0.0 return a + b
memory_profiler
首先需要安装依赖库memory_profiler pip install memory_profiler
1234567891011121314151617181920
1.在需要测试的函数加上@profile装饰2.执行命令: python -m memory_profiler line_profile_test.py输出如下:Filename: line_profile_test.pyLine # Mem usage Increment Line Contents================================================ 5 30.855 MiB 30.855 MiB @profile 6 def fun(): 7 30.855 MiB 0.000 MiB a = 0 8 30.855 MiB 0.000 MiB b = 0 9 33.961 MiB 3.105 MiB for i in range(100000):10 33.961 MiB 0.000 MiB a = a + i * i1112 33.961 MiB 0.000 MiB for i in range(3):13 33.961 MiB 0.000 MiB b += 114 33.961 MiB 0.000 MiB time.sleep(0.1)1516 33.961 MiB 0.000 MiB return a + b
objgraph
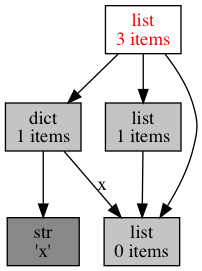
Python Object Graphs库提供的objgraph可以用于绘制python对象图。绘制时依赖库graphviz brew install graphviz(mac os)和xdot可以通过pip install xdot
1234567
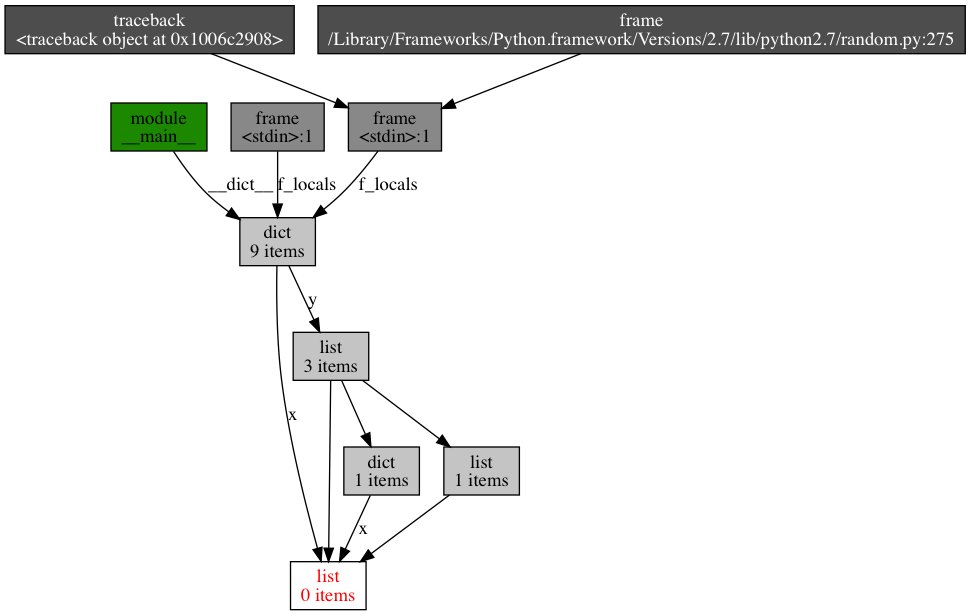
>>> x = []>>> y = [x, [x], dict(x=x)]>>> import objgraph>>> objgraph.show_refs([y], filename='sample-graph.png')Graph written to ....dot (... nodes)Image generated as sample-graph.png>>> objgraph.show_backrefs([x], filename='sample-backref-graph.png')
画图如下: